Using Microsoft 365 Copilot and Work IQ for Timesheets, Project Catch-Ups, and the Admin You've Been Putting Off2 August 2026·1334 words·7 minsAI Microsoft 365 Productivity Microsoft 365 Copilot Work IQ Copilot Productivity
GH-300: The GitHub Copilot Exam Is Worth Your Time (Especially If You Use Copilot Every Day)1 August 2026·883 words·5 minsAI GitHub Exams GitHub Copilot GH-300 Certifications
Why I'm Working Through Level Up's Frontier Learning Journey (And You Should Too)18 July 2026·746 words·4 minsAI Azure
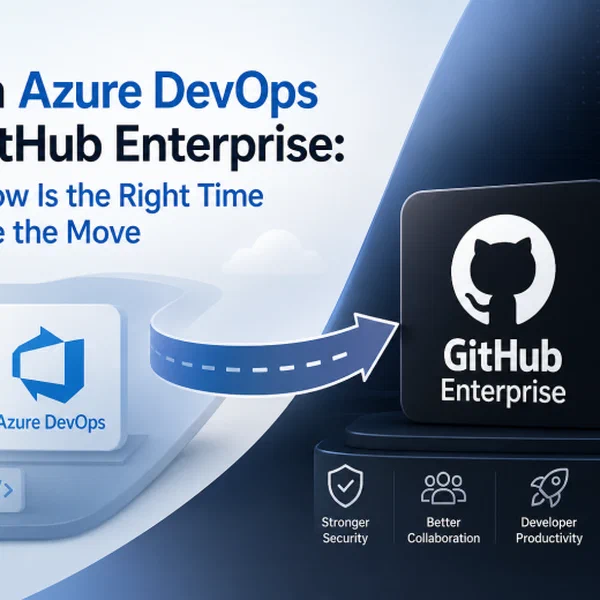
From Azure DevOps to GitHub Enterprise: Why Now Is the Right Time to Make the Move4 May 2026·1477 words·7 minsGitHub
Building AppInsights Analyser: A Blazor Dashboard for Azure Application Insights18 April 2026·511 words·3 minsAI GitHub
Pulling Off the Perfect Sprint Review Heist with Copilot, Squad and Oceans Eleven8 March 2026·625 words·3 minsAI GitHub