A few weeks back I was trying to answer what should have been a simple question for a client: “are all our public endpoints actually protected by a WAF, and is it doing anything useful?” There’s no single blade for that. You end up with a spreadsheet - open every Front Door profile, check which endpoints have a security policy attached, open every Application Gateway, check which listeners have a WAF policy linked (gateway-level, per-listener, or the old inline config if it’s an older gateway), then check whether each policy is actually in Prevention mode or just sitting there in Detection quietly logging traffic nobody reads, then check whether the managed rule set is current, then check whether diagnostic logging is even switched on so you’d know if it blocked anything. Multiply that across a tenant with a dozen subscriptions and you’ve lost an afternoon and you still don’t have a number you can put in front of a manager.
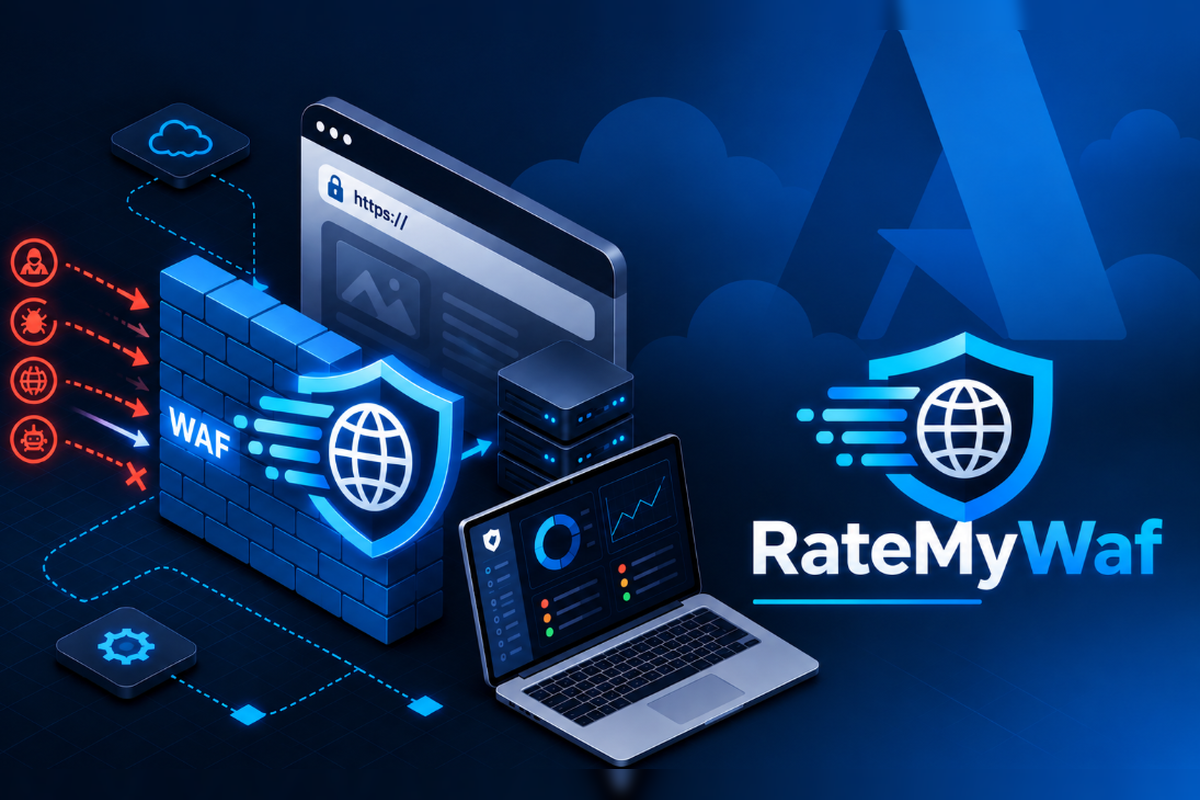
That’s the itch RateMyWAF scratches. Point it at a tenant, pick a flow, and instead of a spreadsheet you get a letter grade per resource, a list of exactly what’s costing you points, and a report you can hand over.
What it actually does#
RateMyWAF is a read-only Blazor Server app (.NET 10) that finds every Azure Front Door and Application Gateway WAF in a tenant and grades each one. It’s two separate flows, one per product, because they don’t map to the same shape of resource:
- Front Door WAFs - classic Front Doors and the newer CDN-profile Front Doors (Standard/Premium), rated per endpoint and per custom domain against whichever security policy actually covers it.
- Application Gateway WAFs - any tier, rated per HTTP listener, accounting for gateway-level policy, per-listener policy, and the legacy inline WAF config for gateways that predate the policy model.
Each flow walks the same three steps: Scope (pick the tenant and subscriptions you want scanned), Grades (the A-F score per resource, findings with concrete fixes, a policy inventory, and a Word report you can export), and Logs (a Log Analytics query over the actual WAF logs that tries to tell you whether what got blocked was a real attack or your own tuning getting in the way, plus fix scripts for anything it finds).
If you don’t have a tenant handy to point it at, there’s a “Try with sample data” option on the home page that runs both flows against a built-in demo estate deliberately built to cover every grade band from A to F, with zero Azure calls. It’s the fastest way to see the whole thing end to end.
The scoring model#
I didn’t want a vague “looks okay” traffic light system - I wanted something a security reviewer could interrogate and trust. So the scoring model works the same way for both products: 100 points spread across six weighted categories.
| Category | Points | What earns it |
|---|---|---|
| WAF coverage & state | 30 | An enabled WAF policy on every endpoint/domain/listener, pro-rated |
| Prevention mode | 20 | Linked policies actually blocking rather than just logging, pro-rated |
| Managed rule protection | 20 | Default rule set (10) - on the latest version (5) - Bot Manager rule set (5) |
| Logging & monitoring | 15 | WAF diagnostic logs enabled (10) - flowing to Log Analytics (5) |
| Tuning hygiene | 10 | Deductions for disabled managed rules, action overrides and exclusions |
| Hardening extras | 5 | Rate-limit rule (2) - geo/IP rule (1) - request body inspection (2) |
That total maps to a letter: A at 90 or above, B at 75, C at 60, D at 45, E at 30, and anything below that is an F.
The bit I think matters more than the raw points, though, is the hard caps, because a weighted average on its own can hide a genuinely dangerous gap. If there’s no enabled WAF anywhere in scope, the grade is capped at F regardless of what else is going on. If even one endpoint, domain, or listener has no WAF attached at all, the whole resource is capped at D - because an uncovered endpoint is worse than one sitting behind a WAF in Detection-only mode, and the score needs to reflect that ordering, not just average it away. Detection-only mode (logging but not blocking) caps the grade at C. No managed rule set at all also caps at C. And having the WAF logging switched off caps you at B, even if everything else is perfect, because a well-configured WAF you can’t observe isn’t fully trustworthy.
The other thing every grade comes with is a ranked list of the specific changes that would move the needle, each one tagged with exactly how many points it’s worth and what grade you’d land on if you made it. So it’s not just “you got a C” - it’s “turning this policy to Prevention mode gets you 20 points and takes you to a B.”
It’s read-only, and that’s deliberate#
Everything RateMyWAF does to reach a grade goes through Azure Resource Graph and ARM GET calls - Front Doors, endpoints, custom domains and security policies; Application Gateways, listeners, URL path rules and legacy inline WAF config; the WAF policies themselves (state, mode, managed rule sets and overrides, exclusions, custom rules, associations); the latest available managed rule set versions per product; and diagnostic settings to see which WAF log categories are enabled and where they’re sent. For the Logs step it runs a Log Analytics query against AzureDiagnostics, FrontDoorWebApplicationFirewallLog, or AGWFirewallLogs depending on the resource.
Authentication defaults to AzureCliCredential, so on your own machine it’s just:
az login
cd src/RateMyWaf
dotnet run
and then open http://localhost:5210. If you need to run it somewhere without the Azure CLI present - App Service, a container on a managed identity - you set Azure:Credential to Default in appsettings.json (or Azure__Credential=Default as an environment variable) and it switches to DefaultAzureCredential. Either way, the credential needs Reader on the subscriptions in scope, and Log Analytics Reader on whatever workspace the WAF logs land in if you want the Logs step to work. Resources often scatter their diagnostic settings across more than one workspace, sometimes in a different subscription, so the Logs step actually enumerates every workspace the credential can see across the tenant and pre-selects the one that’s actually receiving the firewall log category for that resource - “Auto-detect” falls back to letting Azure locate it via the resource-centric query if you’d rather not pick.
It genuinely never modifies anything. The remediation side of the app - the fix scripts you get from a finding - are PowerShell that gets generated for you to read, adjust if needed, and run yourself. RateMyWAF doesn’t hold any write permissions and wouldn’t do anything with them if it did.
Built in an hour, with Copilot CLI doing the heavy lifting#
This is the same pattern I used for the Azure governance app I built a few months back - sit down with GitHub Copilot CLI in GitHub CLI (gh copilot), describe the shape of the problem, and iterate module by module rather than trying to write the whole thing myself from a blank file. I built RateMyWAF in an hour and the workflow that worked well the first time round worked well again: plan the scoring model and the resource discovery logic in detail before generating any code, then let Copilot scaffold the Blazor components, the discovery services, and the rating engine while I reviewed and steered.
Where this project differed from the governance app was in how unforgiving the domain is. A maturity score can afford to be a bit soft around the edges; a security grade can’t, because if RateMyWAF told someone their WAF was fine when it wasn’t, that’s a genuinely bad outcome. So I spent more time than usual on the test suite - it’s xUnit and bUnit, and the rating engine tests are built around the reference cases specifically so they have to keep producing identical scores as the code evolves. There’s also a Playwright-driven walkthrough script (tests/e2e/walkthrough.mjs) that drives the running app in headless Chromium through both flows against the sample data - scan, grades, findings, policy detail, reports, log analysis, fix scripts, a reload, dark theme, and a mobile viewport - and fails on any browser error. Copilot generated most of that scaffolding too, but the reference cases and the pass/fail thresholds are mine, because that’s the part I wasn’t willing to hand off.
Caveats worth knowing before you rely on it#
It’s read-only by design, so there’s no auto-remediation - you get a script, not a click-to-fix button, and that’s intentional rather than a gap I plan to close. It only covers Front Door and Application Gateway today; if your estate leans on Azure API Management’s WAF-adjacent policies, Web App-level restrictions, or a third-party WAF in front of Azure, none of that is in scope yet. The fix scripts are a starting point, not a guarantee - they still need a human to read them, check they make sense for that specific policy, and run them. And the grade is only as complete as the permissions behind it: without Log Analytics Reader on the right workspace the Logs step simply can’t tell you anything, and without Reader on every subscription in the tenant you’ll get an accurate grade for what it could see, not a guarantee that nothing was missed.
Final thoughts#
If you’ve ever tried to answer “how good is our WAF coverage, actually” with anything other than a shrug, this is the tool I wished existed. Clone it, run az login and dotnet run, and point it at a subscription you know reasonably well first - you’ll probably learn something about a policy you forgot was in Detection mode. If you don’t have Azure access to hand right now, click “Try with sample data” on the home page and walk through both flows against the demo estate - it covers every grade from A to F, so you’ll see exactly what a capped D looks like next to a clean A before you ever point it at anything real.