I was doing a review of an internal project few weeks back, looking at what’s deployed and how it’s set up. Every App Service had an Application Insights resource next to it. Good start. So I asked the obvious question: “When did someone last open one of these?” Long pause. Then, “I think the dev who set it up left last year.” I opened the Failures blade on their main customer-facing API and there it was - a dependency to a third-party payments endpoint failing roughly 4% of the time, steadily, for as far back as the retention went. Nobody knew. The data had been sitting there for months, getting paid for, telling a story that nobody was reading.
I see this constantly. Not occasionally - constantly. Application Insights is probably the most widely deployed and least looked-at monitoring tool in Azure, and I want to talk about why that is, what you’re missing by ignoring it, and how to fix it in about thirty minutes.
Why it ends up abandoned#
It’s not that people don’t care. It’s that Application Insights gets created as a side effect rather than a decision. You tick the box when you create a Web App in the portal. It’s in the Bicep template someone copied from the last project. The App Service extension gets turned on because a Defender recommendation said so. At no point does anyone sit down and say “this is our application monitoring, here’s who owns it, and here’s what good looks like.”
So it ends up with no owner. Developers think of it as a debugging tool for when something’s broken locally, and the ops side thinks of it as a dev thing. Nobody configures alerts, so it never taps anyone on the shoulder. And because nobody’s looked at it, nobody knows what “normal” looks like for the app, which means even when someone does open it during an incident they can’t tell the difference between “this is bad” and “this is Tuesday.”
The end result is an ingestion bill, a Log Analytics workspace with a few GB a day landing in it, and absolutely no operational value coming back out.
What it’s already telling you#
Here’s the thing that frustrates me about all this: the data is genuinely good. You don’t need to add anything or instrument anything else. The first time someone opens the blades properly, they almost always find something. A few I’ve seen in the last year alone:
- A slow SQL query that everyone blamed on “the database being a bit slow” that turned out to be one specific stored procedure called 40 times per page load. The Performance blade had it at the top of the dependencies list, sorted by total duration, for anyone who’d looked.
- A dependency to an internal service that had been decommissioned. The app was still calling it, timing out, catching the exception, and carrying on. Every single request paid a 30-second timeout penalty and nobody noticed because it eventually worked.
- An exception being thrown thousands of times an hour, swallowed by a try/catch, logged to App Insights, and never surfaced anywhere a human would see it.
- A 500 error spike at 03:00 every night that lined up perfectly with a scheduled job hammering the same database the API used.
- An Application Map showing a dependency on a storage account in a completely different subscription that nobody on the current team could explain.
None of those needed a query. They were all sitting in the default blades - Failures, Performance, Application Map - waiting to be clicked on. Add Live Metrics for watching a deployment go out in real time, Availability for synthetic tests from outside your network, and Smart Detection for the anomaly stuff that runs whether you asked for it or not, and you’ve got a properly capable operations tool that’s already switched on.
The first thirty minutes#
If you’ve got an App Insights resource you haven’t opened in a while, here’s what I’d do, in this order. Set the time range to the last seven days for all of it.
Application Map first. Not because it’s the most useful, but because it tells you what the app actually talks to, and that’s often a surprise. Look for dependencies you didn’t know about, anything with a red ring around it, and anything where the average call duration is higher than you’d expect for what it is. If a “cache” dependency shows an average of 400ms, that’s not a cache.
Failures blade next. Look at the failed request count over time - is it flat, spiky, or trending? Then flip through the three tabs: operations, dependencies, exceptions. Sort by count. The top three items on each tab are your first three conversations with the dev team.
Performance blade third. Same idea. Sort operations by total duration rather than average - one slow operation called constantly matters more than one very slow operation called once a day. Then look at the dependency tab the same way.
Availability last. If there are no tests configured, that’s a finding in itself. If there are, check they’re actually passing, and check the alert rule attached to them has an action group, because by default it can end up only notifying in the portal.
Once you’ve done the click-through, it’s worth running a handful of queries so you’ve got numbers rather than impressions. These all run from the Logs blade on the App Insights resource. I’ve used sum(itemCount) rather than count() throughout so the numbers are right even if sampling is on.
Failure rate over time. You’re looking for the shape - is there a daily pattern, a step change, a slow climb?
requests
| where timestamp > ago(7d)
| summarize total = sum(itemCount), failed = sumif(itemCount, success == false) by bin(timestamp, 1h)
| extend failureRate = round(100.0 * failed / total, 2)
| project timestamp, failureRate, total
| render timechart
Slowest operations by P95. Averages hide things. P95 tells you what one in twenty users is actually experiencing. Anything over a second or two on an interactive endpoint deserves a look, and the calls filter keeps rare operations from cluttering the top of the list.
requests
| where timestamp > ago(7d)
| summarize calls = sum(itemCount), p50 = percentile(duration, 50), p95 = percentile(duration, 95) by name
| where calls > 100
| order by p95 desc
| take 15
Top exceptions. Grouping by problemId collapses the same exception from the same place into one row, which is what you want. Look at the top five and ask whether anyone knows they’re happening.
exceptions
| where timestamp > ago(7d)
| summarize occurrences = sum(itemCount), lastSeen = max(timestamp) by problemId, type, outerMessage
| order by occurrences desc
| take 20
Dependency failures by target. This is the query that found the payments issue I mentioned at the start. Failures grouped by what you were calling and what it said back.
dependencies
| where timestamp > ago(7d) and success == false
| summarize failures = sum(itemCount), sampleResultCode = take_any(resultCode) by type, target, name
| order by failures desc
| take 20
Slowest dependencies. The partner to the one above. A dependency that never fails but takes 800ms every time is still a problem.
dependencies
| where timestamp > ago(7d)
| summarize calls = sum(itemCount), p95 = percentile(duration, 95) by type, target
| where calls > 100
| order by p95 desc
| take 15
Availability by test and location. If a single location is consistently worse than the others it’s usually a networking or CDN thing rather than your app, which is useful to know before you start blaming code.
availabilityResults
| where timestamp > ago(7d)
| summarize passed = countif(success == true), failed = countif(success == false) by name, location
| extend availabilityPct = round(100.0 * passed / (passed + failed), 2)
| order by availabilityPct asc
Half an hour, six queries, and you’ll know more about how that application actually behaves than most of the people who built it.
Turning a one-off into a habit#
The review above is useful once. It’s transformative if it happens every week. The trick is making it small enough that it actually keeps happening.
Give it an owner. One named person per application whose job includes looking at App Insights. Not a team, a person. It goes on their calendar, fifteen minutes, same time every week. Failures blade, Performance blade, anything new in Smart Detection, done.
Set up availability tests. A standard test from five locations, hitting a health endpoint every five minutes, with the alert wired to an action group. That’s your outside-in view, and it’s the single most valuable thing you can add if there’s nothing there now. One caveat: the older URL ping tests are being retired on 30 September 2026 and will be removed from your resources, so if you’ve got any of those lying around, migrate them to standard tests now rather than finding out the hard way.
A small set of alerts. Four is plenty to start with: failed requests above a threshold, server response time above a threshold, availability below a threshold, and exception count above a threshold. Metric alerts, one minute evaluation, five minute window, all pointing at the same action group. Resist the urge to alert on everything - four alerts that people trust beat forty that get muted.
Make the smart detection alerts go somewhere. Failure Anomalies is on by default and uses machine learning to spot when your failure rate leaves its normal envelope. By default it sends an email to subscription owners, which in most organisations means it goes to a shared mailbox nobody reads. Migrate the smart detection rules to proper alert rules (there’s a one-click migration on the Smart Detection settings pane) and attach the same action group.
Pin something. A workbook or a dashboard with the failure rate, P95 response time, and availability for the last 24 hours. Doesn’t need to be clever. The point is that someone glances at it on a Monday morning and notices when the line looks different.
If you’re not going to look at it, at least stop overpaying for it#
I’ll be blunt: if after reading this you still know nobody’s going to open it, then at minimum stop paying full price for data nobody reads. Three settings.
Sampling. The modern OpenTelemetry-based distros ship with a sampler on by default, but the rate depends on the language and SDK version, so check rather than assume. Ingestion sampling in the portal (Usage and estimated costs > Data sampling) is the fallback when you can’t touch the code, but Microsoft are fairly clear it’s a last resort because it drops data after the fact and can leave you with broken traces. This query tells you what’s actually being retained - anything under 100 means sampling is happening:
union requests, dependencies, pageViews, browserTimings, exceptions, traces
| where timestamp > ago(1d)
| summarize retainedPercentage = 100 / avg(itemCount) by bin(timestamp, 1h), itemType
Daily cap. For a workspace-based resource the cap lives on the Log Analytics workspace (and the effective limit is the lower of the workspace cap and any App Insights cap). It’s a safety net, not a cost strategy - when you hit it, ingestion stops and you’re blind until the reset. Set it high enough that you’ll never hit it normally, and create the alert on the _LogOperation table so you find out if you do.
Retention. The Application Insights tables in a workspace (AppRequests, AppDependencies, AppExceptions and friends) get 90 days of retention at no extra charge. If you’ve bumped the workspace default to 180 or 365 days for other reasons, check whether the App tables inherited that, because you’re paying retention on data nobody queries. Retention can be set per table, so pull the App tables back to 90 and leave the rest alone.
And if you’ve still got a classic (non-workspace) Application Insights resource kicking about - those were retired back in early 2024 - it’s worth migrating, partly so the App tables land in a workspace where you can manage retention and caps properly, and partly so you can take advantage of commitment tiers on the workspace if your overall ingestion is big enough to justify it.
Deploy the alerting with the resource#
This is the bit that actually stops the problem recurring. If the alert rule is in the same Bicep file as the App Insights resource, it can’t get forgotten - it’s deployed every time, on every environment, with no ticking of boxes required. Here’s a workspace, a workspace-based App Insights resource, and a failed requests metric alert, all in one file. It compiles cleanly with the current Bicep CLI.
param location string = resourceGroup().location
param appName string
param actionGroupId string

resource logAnalytics 'Microsoft.OperationalInsights/workspaces@2025-07-01' = {
  name: 'log-${appName}'
  location: location
  properties: {
    sku: {
      name: 'PerGB2018'
    }
    retentionInDays: 30
    workspaceCapping: {
      dailyQuotaGb: 5
    }
  }
}

resource appInsights 'Microsoft.Insights/components@2020-02-02' = {
  name: 'appi-${appName}'
  location: location
  kind: 'web'
  properties: {
    Application_Type: 'web'
    WorkspaceResourceId: logAnalytics.id
    IngestionMode: 'LogAnalytics'
  }
}

resource failedRequestsAlert 'Microsoft.Insights/metricAlerts@2026-01-01' = {
  name: 'alert-${appName}-failed-requests'
  location: 'global'
  properties: {
    description: 'More than 10 failed requests in a 5 minute window'
    severity: 2
    enabled: true
    scopes: [
      appInsights.id
    ]
    evaluationFrequency: 'PT1M'
    windowSize: 'PT5M'
    autoMitigate: true
    criteria: {
      'odata.type': 'Microsoft.Azure.Monitor.SingleResourceMultipleMetricCriteria'
      allOf: [
        {
          name: 'FailedRequests'
          criterionType: 'StaticThresholdCriterion'
          metricNamespace: 'microsoft.insights/components'
          metricName: 'requests/failed'
          operator: 'GreaterThan'
          threshold: 10
          timeAggregation: 'Count'
        }
      ]
    }
    actions: [
      {
        actionGroupId: actionGroupId
      }
    ]
  }
}
A few notes. The metric alert’s location is always global regardless of where the resource lives. The threshold of 10 is a placeholder - set it based on what the failure rate query above told you is normal, not on a guess. And the other three alerts I mentioned are the same resource with a different metric: requests/duration with timeAggregation: 'Average' and a threshold in milliseconds for response time, exceptions/count with Count for exceptions, and availabilityResults/availabilityPercentage with Average and operator: 'LessThan' for availability. Copy the block, change four lines, done.
Put the action group in a shared module, pass its ID in, and every application you deploy from now on comes out of the pipeline with monitoring that actually tells someone when it breaks.
Final thoughts#
Application Insights isn’t a tool you set up. It’s a tool you read. All the value is in the reading, and the setting up is just the bit that makes reading possible. If your organisation has done the second bit and not the first, you’ve got the cost without the benefit, and the fix is embarrassingly cheap: one person, fifteen minutes a week, and four alert rules deployed alongside the resource.
So here’s my ask. Pick one application - the one that would cause the most grief if it fell over - and open its Failures blade today. Set the range to seven days. I’d bet money you find something. Then, once you’ve fixed that, wire up the alerts so you never have to rely on remembering to look.
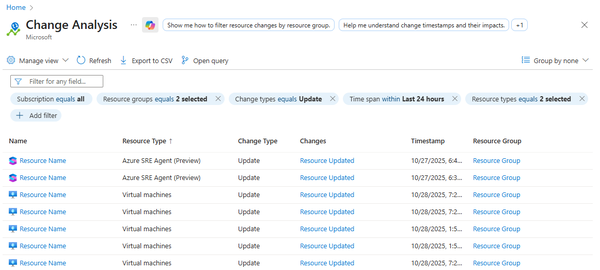
If you’re already in that frame of mind, a couple of related posts might help. Change Analysis is the next thing to open once App Insights tells you when something broke and you need to know what changed. The Resiliency experience in the portal covers the other side of the coin - whether the app would survive the failure that App Insights is about to warn you about. And if you’re managing a lot of App Insights resources across subscriptions and the portal is slowing you down, I built AppInsights Analyser, a Blazor dashboard that pulls the same telemetry into one view.