There’s a question that comes up in almost every incident call I’ve ever been on, usually about ten minutes in, usually asked slightly too loudly: “Did anything change recently?” And then everyone looks at each other, someone opens the activity log, someone else starts scrolling through a deployment pipeline’s history, and twenty minutes later you’ve found the answer sitting in a completely different blade than the one you started in. I’ve lost count of how many outages turned out to be “oh, someone bumped the VM size” or “a policy remediation flipped a setting back” - obvious in hindsight, infuriating to actually track down in the moment.
That’s the exact problem Change Analysis is built to solve, and it’s gone through a proper glow-up recently. It’s now built directly on Azure Resource Graph, it’s on by default for everything, and it’s free. I’ve been using it to chase down a couple of “why did this break” moments over the last few weeks, and it’s earned a permanent spot in my troubleshooting routine.
What it actually is#
Change Analysis tracks control-plane changes to your Azure resources - anything sent through Azure Resource Manager - and keeps a record of exactly what changed, when, and who or what triggered it. Not “a change happened to this resource group,” but the actual property-level diff: this VM’s size went from Standard_D2s_v3 to Standard_D4s_v3, this storage account’s public network access flipped from Disabled to Enabled, this NSG rule’s priority moved from 100 to 200.
The important shift is that it’s now powered by Azure Resource Graph rather than being a separate opt-in service. That means:
- No onboarding. Every subscription and resource already has change history available - there’s nothing to enable or register.
- Tenant-wide by default. You’re not stuck querying one subscription at a time.
- No extra cost. It’s included, full stop.
If you used the older Change Analysis experience (the one built on the Microsoft.ChangeAnalysis resource provider, tied to Application Insights), that classic version was retired at the end of October 2025. Anything you had wired up against the old API needs to move to the Resource Graph-based version - which, to be fair, is the better tool anyway.
Finding it in the portal#
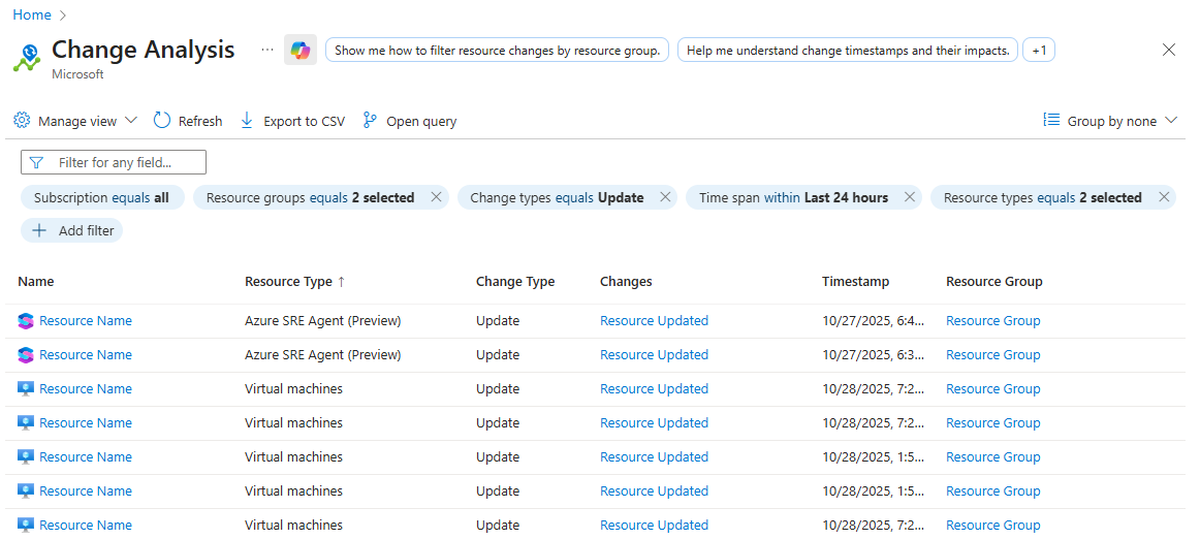
Search “Change Analysis” in the portal search bar and you land on a proper results grid rather than a summary dashboard - which is exactly what you want when you’re mid-incident and just need to see a list. From there you can filter by subscription, resource group, time span, change type, resource type, resource name, correlation ID, and who made the change - and group the results by any of those same dimensions. If you’re chasing a specific outage, filtering to “the last two hours” and grouping by “Changed By” will usually get you to the culprit faster than anything else in the portal.
Each change record tells you the change type (Create, Update, Delete), who or what made it, which client they used (Azure Portal, CLI, ARM template, and so on), and the specific properties that changed with their old and new values side by side. That’s the bit that actually saves time - you’re not just told “this resource was updated,” you’re shown precisely what moved.
It’s just Resource Graph under the hood - so you can query it#
This is the part I like best. Because it’s built on Resource Graph, you’re not limited to clicking through a portal grid - you can run KQL against the resourcechanges table (and its siblings, resourcecontainerchanges for management groups and subscriptions, and healthresourcechanges) from the CLI, PowerShell, or Resource Graph Explorer.
A basic query to see the most recent changes across your tenant looks like this:
resourcechanges
| extend changeTime = todatetime(properties.changeAttributes.timestamp),
  targetResourceId = tostring(properties.targetResourceId),
  changeType = tostring(properties.changeType),
  changedBy = tostring(properties.changeAttributes.changedBy),
  changedProperties = properties.changes
| order by changeTime desc
| project changeTime, targetResourceId, changeType, changedBy, changedProperties
| limit 20
Or az graph query -q '...' if you’d rather stay in the CLI. Once you’ve got that, it’s just KQL, so you can shape it however the situation needs. A couple I’ve actually used:
“What got deleted in this resource group this week?”
resourcechanges
| where resourceGroup == "myResourceGroup"
| extend changeTime = todatetime(properties.changeAttributes.timestamp),
  changeType = tostring(properties.changeType)
| where changeType == "Delete" and changeTime > ago(7d)
| project changeTime, resourceGroup, targetResourceId = tostring(properties.targetResourceId)
“Who’s making the most changes, and how?”
resourcechanges
| extend changeTime = todatetime(properties.changeAttributes.timestamp),
  changedBy = tostring(properties.changeAttributes.changedBy),
  clientType = tostring(properties.changeAttributes.clientType),
  changeType = tostring(properties.changeType)
| where changeTime > ago(7d)
| summarize count() by changedBy, clientType, changeType
| order by count_ desc
That second one is genuinely useful outside of incident response too - it’s a quick way to spot “why does this keep drifting” patterns, like a runbook or Logic App quietly reverting a setting every night.
Where the “who” comes from#
Every change record carries three fields worth knowing about: changedBy (the user or application that made the change), clientType (how - Azure Portal, CLI, an SDK), and operation (the RBAC permission that was exercised, like Microsoft.Compute/virtualMachines/write). Worth knowing what the placeholder values mean before you assume something’s broken:
- Unspecified - no identity or client info was available at all for that change.
- Unknown - identity info was present, but the client wasn’t one Resource Graph recognises.
- System - a background platform operation with no direct user action behind it (auto-healing, platform maintenance, that sort of thing).
Seeing “System” as the culprit is often as useful as seeing a name - it tells you to stop looking at your team and start looking at the platform.
The caveats#
- 14 days of retention, by default. Change history is queryable for two weeks. If you need it for longer - compliance, quarterly reviews, whatever - you’ll need to export it yourself, typically via a Logic App pulling Resource Graph query results into Log Analytics or another data store on a schedule. It doesn’t retain anything longer for you automatically.
- Control plane only. This tracks changes made through Azure Resource Manager. It won’t tell you that someone wrote a new row into a storage table or changed a value inside an application’s own config store - that’s data plane, and it’s out of scope here.
- App Service file and configuration change tracking isn’t part of this version yet. If you relied on the classic Application Change Analysis experience specifically for tracking file-level changes inside an App Service, that capability hasn’t carried over to the Resource Graph-based version. Worth knowing before you assume parity with the old tool.
- Five minutes, not real time. Change records typically show up within about five minutes of the change happening, and some details can lag behind others slightly. Close enough for almost everything, but don’t expect it to be instantaneous.
Final thoughts#
None of this is flashy, and that’s kind of the point. Change Analysis isn’t trying to be a dashboard you check every morning - it’s the thing you reach for at 2pm when a service that was working fine an hour ago suddenly isn’t, and you need a factual answer to “what changed” instead of a round of guessing. The fact that it now needs zero setup, covers your whole tenant, and costs nothing removes every excuse not to have it in your back pocket.
Next time something breaks and nobody in the call can explain why, skip the tab-switching. Search “Change Analysis,” filter to the last hour or two, and let the platform tell you what actually happened.