Recently Microsoft announed that they will have a grana service available to use on Azure - awesome stuff.
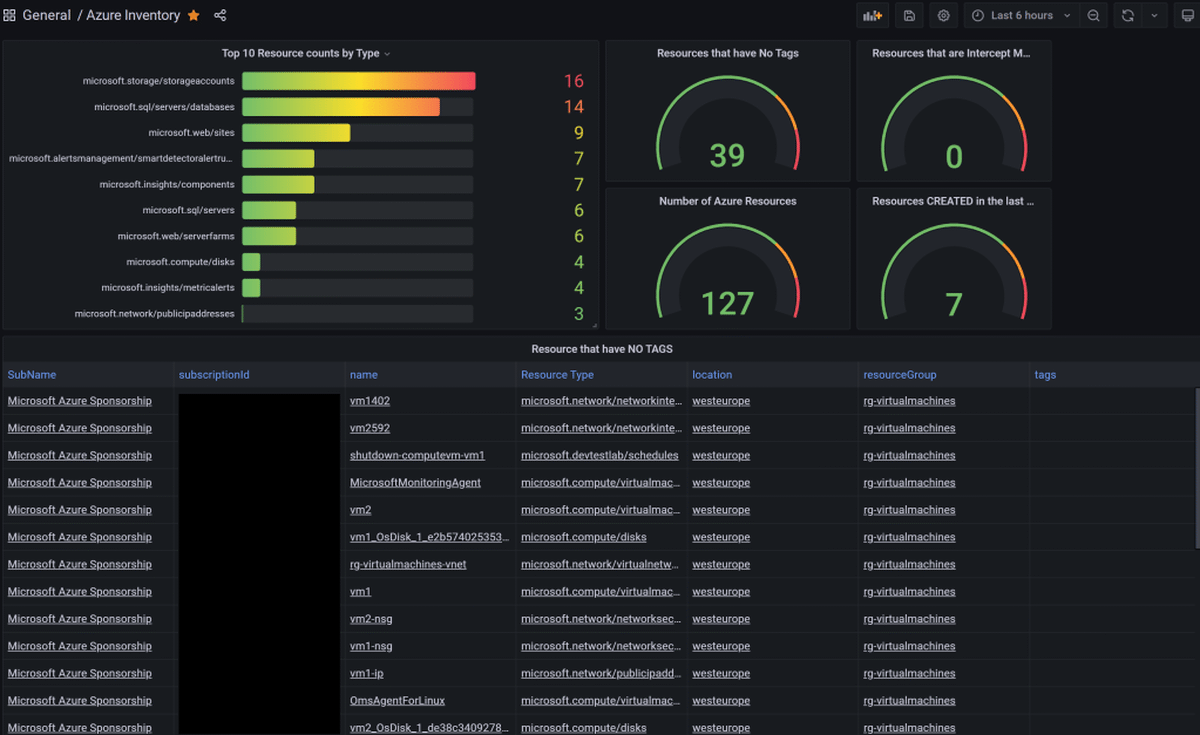
I like Grafana for dashboards, its got a bit to go however, esepcially when it comes to alerts and doing things at scale.
You can choose to run Grafana **locally **(im running it on windows), you can run it in a **container **and you can run it on Azure, no matter where you use it, there are a few things which I wanted to cover off to help people who are considering using it.
Now I am currently using version 8.4.5 and I wanted to create some azure alerts to see what Grafana had in the way of alerts, it has some nice stuff to be fair, how it goes about it needs some work but I reckon it will definetly get there in upcoming versions.

Currently creating dashboards is very simple, when it comes to azure you need to:-
- Create a data source (azure monitor)
- Add a panel to a new dashboard
- Select the datasource and then choose either Metrics, Logs or Azure Resource Graph.
- Fill out the details
Simple stuff, now what about if you want to create an alert, well the dashboard you create is stored in JSON which contains all of th panels and the settings etc - alerts are stored seperately, to be honest I think alerts are still being worked on.
Anyways alerts are stored elsewhere, the good news is there is an API for Grafana, the bad news is, its not the best, either that or the documentation is wrong - if you try it out and it all just works please do give me a shout.
If you want to create alert rules which is, you creating settings, that define when an alert should fire, lets say if your virtual machine cpu goes abouve 75% cpu for between 1-5 minutes then raise a alert. An Alert is made up of whats called contact points ans notification policies in Grafana, now this idea I do like.
To create an Alert Rule you could do the following:-
POST http://localhost:3000/api/ruler/grafana/api/v1/rules/{your folder name here}
In the JSON believe replace {your datasource uid here} with the uid of your own datasource and also replace {your subscription id here} with your own subsciptionId.
{
“name”: “FUNCTION APPS - HTTP Server Errors (Total)”,
“interval”: “1m”,
“rules”: [
{
“expr”: “”,
“for”: “5m”,
“labels”: {
“Customer”: “test customer”,
“alertto”: “gregor”
},
“annotations”: {
“summary”: “FUNCTION APPS - HTTP Server Errors > 100”
},
“grafana_alert”: {
“id”: 115,
“orgId”: 27,
“title”: “FUNCTION APPS - HTTP Server Errors (Total)”,
“condition”: “B”,
“data”: [
{
“refId”: “A”,
“queryType”: “Azure Monitor”,
“relativeTimeRange”: {
“from”: 600,
“to”: 0
},
“datasourceUid”: “{your datasource uid here}”,
“model”: {
“azureMonitor”: {
“aggregation”: “Total”,
“alias”: “{{ resourcename }} - {{ metric }}”,
“dimensionFilters”: [],
“metricDefinition”: “Microsoft.Web/sites”,
“metricName”: “Http5xx”,
“metricNamespace”: “Microsoft.Web/sites”,
“resourceGroup”: “rg-grafanaresources”,
“resourceName”: “grafana1”,
“timeGrain”: “auto”
},
“hide”: false,
“intervalMs”: 1000,
“maxDataPoints”: 43200,
“queryType”: “Azure Monitor”,
“refId”: “A”,
“subscription”: “{your subscription id here}”
}
},
{
“refId”: “B”,
“queryType”: “”,
“relativeTimeRange”: {
“from”: 0,
“to”: 0
},
“datasourceUid”: “-100”,
“model”: {
“conditions”: [
{
“evaluator”: {
“params”: [
100
],
“type”: “gt”
},
“operator”: {
“type”: “and”
},
“query”: {
“params”: [
“A”
]
},
“reducer”: {
“params”: [],
“type”: “last”
},
“type”: “query”
}
],
“datasource”: {
“type”: “expr”,
“uid”: “-100”
},
“hide”: false,
“intervalMs”: 1000,
“maxDataPoints”: 43200,
“refId”: “B”,
“type”: “classic_conditions”
}
}
],
“intervalSeconds”: 60,
“rule_group”: “FUNCTION APPS - HTTP Server Errors (Total)”,
“no_data_state”: “NoData”,
“exec_err_state”: “Alerting”
}
},
{
“expr”: “”,
“for”: “5m”,
“labels”: {
“Customer”: “test customer”,
“alertto”: “gregor”
},
“annotations”: {
“summary”: “Azure SQL - DATA IO % > 75%”
},
“grafana_alert”: {
“id”: 121,
“orgId”: 27,
“title”: “Azure SQL - Log IO %”,
“condition”: “B”,
“data”: [
{
“refId”: “A”,
“queryType”: “Azure Monitor”,
“relativeTimeRange”: {
“from”: 600,
“to”: 0
},
“datasourceUid”: “{your datasource uid here}”,
“model”: {
“azureMonitor”: {
“aggregation”: “Average”,
“alias”: “{{ resourcename }} - {{ metric }}”,
“dimensionFilters”: [],
“metricDefinition”: “Microsoft.Sql/servers/databases”,
“metricName”: “log_write_percent”,
“metricNamespace”: “Microsoft.Sql/servers/databases”,
“resourceGroup”: “rg-grafanaresources”,
“resourceName”: “grafanadb/grafanadb”,
“timeGrain”: “auto”
},
“hide”: false,
“intervalMs”: 1000,
“maxDataPoints”: 43200,
“queryType”: “Azure Monitor”,
“refId”: “A”,
“subscription”: “{your subscription id here}”
}
},
{
“refId”: “B”,
“queryType”: “”,
“relativeTimeRange”: {
“from”: 0,
“to”: 0
},
“datasourceUid”: “-100”,
“model”: {
“conditions”: [
{
“evaluator”: {
“params”: [
75
],
“type”: “gt”
},
“operator”: {
“type”: “and”
},
“query”: {
“params”: [
“A”
]
},
“reducer”: {
“params”: [],
“type”: “last”
},
“type”: “query”
}
],
“datasource”: {
“type”: “expr”,
“uid”: “-100”
},
“hide”: false,
“intervalMs”: 1000,
“maxDataPoints”: 43200,
“refId”: “B”,
“type”: “classic_conditions”
}
}
],
“intervalSeconds”: 60,
“rule_group”: “Azure SQL - Log IO %”,
“no_data_state”: “NoData”,
“exec_err_state”: “Alerting”
}
}
]
}
Lots of companies have products that produce nice dashboards but in my opinion a dashboard is useless on its own, you shouldnt have to look at a dashboard for the most part, especially if your doing something at scale at least. So, I want to have a dashboard with alerts that email me or create a TopDesk ticket or ServiceNow ticket when there is something awry.
Contact points in Grafana are basically how should someone or something be contacted, these are normally email addresses or end points like an azure function end point which you ca nuse to create tickets for example.
Notification policies are policies that act on the settings you provide, an example would be if a label is matched then use of of the contact points to do something - so if an alert is raised and the label is prodcution on your dashboard then you can send an alert to the contact point you created to call an azure function which will create a ServiceNow ticket.
The Grafana API can be found here - https://editor.swagger.io/?url=https://raw.githubusercontent.com/grafana/grafana/main/pkg/services/ngalert/api/tooling/post.json
Its an interesting mix of v1 / v2 end points and some work some dont. I have had no luck getting endpoints for contact points and notification policies to work - but you can use the following calls to get and save the config should you want to create more of these at scale in other dashboards.
GET http://localhost:3000/api/alertmanager/grafana/config/api/v1/alerts
{ “template_files”: {}, “alertmanager_config”: { “route”: { “receiver”: “grafana-default-email”, “routes”: [ { “object_matchers”: [ [ “customer”, “=”, “test customer” ] ] } ] }, “templates”: null, “receivers”: [ { “name”: “grafana-default-email”, “grafana_managed_receiver_configs”: [ { “uid”: “ED40XnQnz”, “name”: “email receiver”, “type”: “email”, “disableResolveMessage”: false, “settings”: { “addresses”: "" }, “secureFields”: {} } ] }, { “name”: “Gregor Suttie”, “grafana_managed_receiver_configs”: [ { “uid”: “ED4AunQ7kz”, “name”: “Gregor Suttie”, “type”: “email”, “disableResolveMessage”: false, “settings”: { “addresses”: “azuregreg@azure.com”, “singleEmail”: false }, “secureFields”: {} } ] } ] } }
Ans you can post the same JSON (without the uid filled out) to create Contact points and Notification policies)
POST http://localhost:3000/api/alertmanager/grafana/config/api/v1/alerts
{ “template_files”: {}, “alertmanager_config”: { “route”: { “receiver”: “grafana-default-email”, “routes”: [ { “object_matchers”: [ [ “customer”, “=”, “test customer” ] ] } ] }, “templates”: null, “receivers”: [ { “name”: “grafana-default-email”, “grafana_managed_receiver_configs”: [ { “uid”: “”, “name”: “email receiver”, “type”: “email”, “disableResolveMessage”: false, “settings”: { “addresses”: "" }, “secureFields”: {} } ] }, { “name”: “Gregor Suttie”, “grafana_managed_receiver_configs”: [ { “uid”: “”, “name”: “Gregor Suttie”, “type”: “email”, “disableResolveMessage”: false, “settings”: { “addresses”: “azuregreg@azure.com”, “singleEmail”: false }, “secureFields”: {} } ] } ] } }
API - the api for grafana is as I mentioned before i bit hit and miss.I use it from Postman and here us how I set Postman to get it working.
I create an API key from within Grafana (under Configuration and then API Keys) and set that as a **Bearer Token **under the Autentication section in Postman like so:-

And the Headers are pretty standard like so:-

If yuou have questions or get stuck reach out to me here int he comments below or on twitter.
Don’t forget to subscribe to my YouTube Channel.