Tip: When your debugging some code and you want to trace the SQL that’s hitting your SQL Server Database then this is how I would normally cut through all the traffic hitting the SQL database your using.
Tip:- Add an application_name part to your connection string in the app.config or web.config, here is an example.
Before:- add name=“TestConn” connectionString=“data source=ServerName;Integrated Security=SSPI;initial Catalog=TESTDB;providerName=“System.Data.SqlClient”
After:- add name=“TestConn” connectionString=“data source=ServerName;Integrated Security=SSPI;initial Catalog=TESTDB;application name=;” providerName=TESTAPP_GREG"System.Data.SqlClient”
Couple of things to notice in the lines above - the second connection string I added an application name, but I also added my name so that when I run the application I can use the application name setting with my name so I only trace my code when I hit the database and no other code being ran will be shown within my trace window.
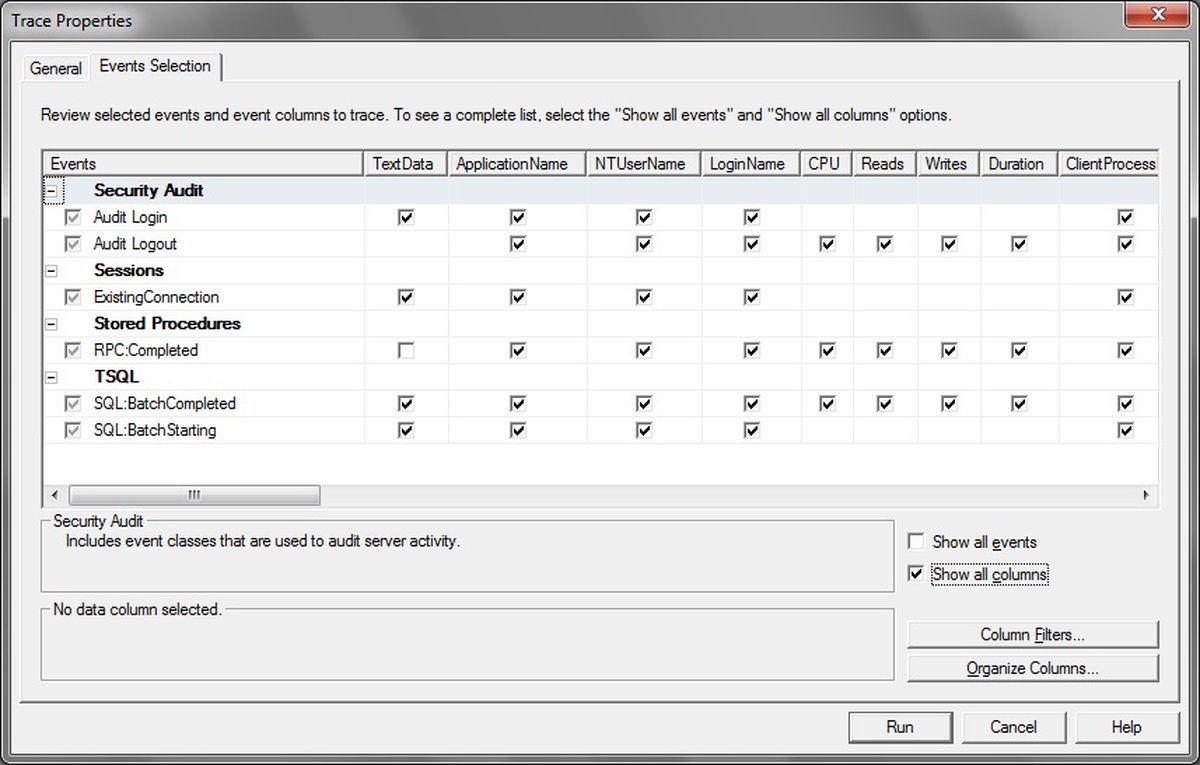
To do this I usually fire up SQL Server Management studio and then from within their fire up SQL Server Profiler and do the following (make sure to click Show All Columns):-

Then add the name of the application name into the box as below:-

Click ok and the only trace information recorded now will be the SQL that you are actually hitting the database with and no one else - enjoy.